My analysis pipeline: notebooks, Quarto, and reproducible posts
methods
python
How a Jupyter-style analysis becomes a web page on this site — with the code executed, not pasted.
Published
August 25, 2026
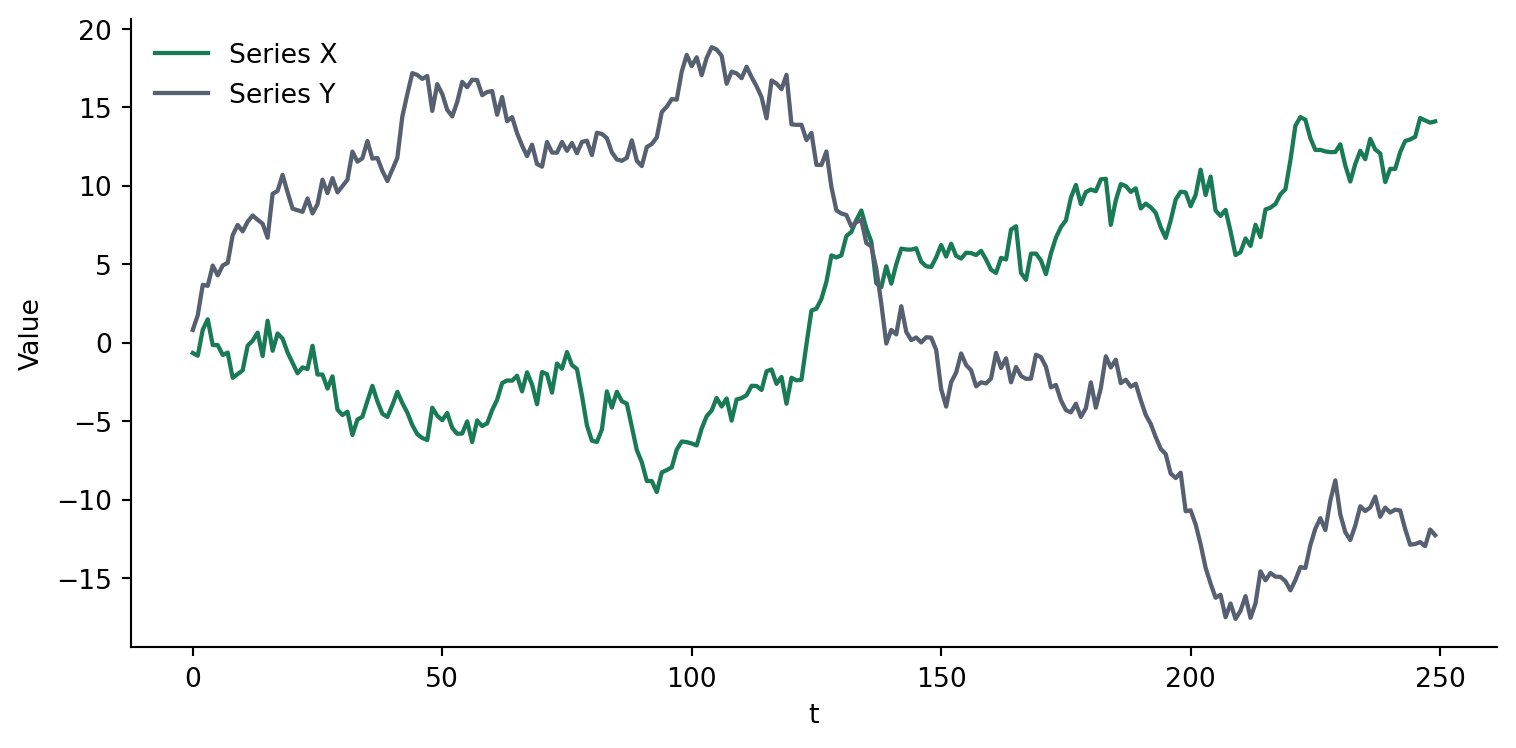
Every empirical post on this site is a Quarto document: Markdown for the prose, with Python code cells that are executed when the site is built. The chart below isn’t a screenshot — it’s generated from the code you can see, every time the page is rendered. That means results and code can’t drift apart, which is the whole point of reproducible research.
Here’s a minimal example: simulating the classic econometric cautionary tale of spurious correlation between two independent random walks.
Figure 1: Two independent random walks. They share no causal link, yet their correlation is high — the classic spurious regression problem (Granger & Newbold, 1974).
And the punchline, computed live:
corr =float(np.corrcoef(x, y)[0, 1])print(f"Pearson correlation between the two independent walks: {corr:.2f}")
Pearson correlation between the two independent walks: -0.90
Two series with no relationship whatsoever, and a correlation near −0.9 that would excite any careless analyst. Non-stationarity does that. It’s a two-line simulation, but it’s also the reason unit-root tests exist, and a decent metaphor for why evaluation results need the same statistical care as any other empirical claim.
The workflow, end to end:
Explore in a Jupyter notebook inside VS Code.
When the analysis stabilises, move it into a .qmd file like this one.
quarto render executes the code and builds the page; results are cached (Quarto’s freeze) so the site rebuilds fast.
Push to GitHub, an Action publishes the site automatically.
Code, results, and write-up live in one file, in version control, in public.